
Index Funds vs. Actively Managed Funds: What the Long-Term Data Generally Shows
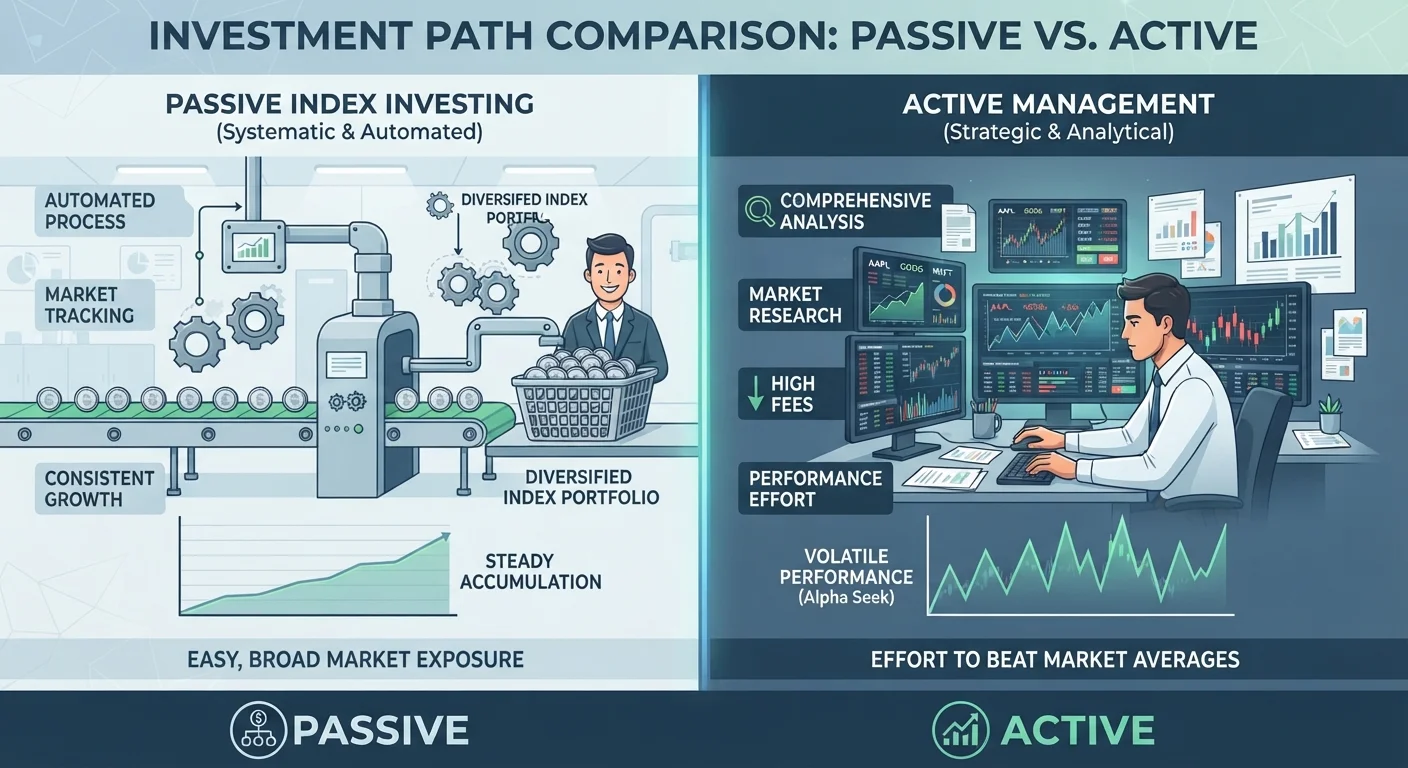
Photo credit: TopInfoTabs.com | Easy Insights For Inspiration
In this article
A factual comparison of passive index investing and active fund management — covering costs, historical performance trends, and what they mean for everyday investors.
Key Takeaways
- Index funds generally have significantly lower expense ratios than actively managed funds.
- Long-term data from sources like S&P SPIVA reports shows most active funds underperform their benchmark index over time.
- Active funds can outperform in specific market conditions, but consistent outperformance is rare and difficult to predict.
- Costs compound over decades - even small fee differences materially affect long-term returns.
- Neither approach suits every investor equally; goals, timeline, and tax situation all matter.
The Core Difference: Philosophy and Mechanics
At their heart, index funds and actively managed funds reflect two opposing views on how markets work. An index fund is a passively managed vehicle that aims to replicate the performance of a specific market index - such as the S&P 500 - by holding the same securities in the same proportions. No team of analysts decides what to buy or sell; the fund simply mirrors the index.
An actively managed fund, by contrast, employs portfolio managers and research teams who make deliberate decisions about which securities to hold, when to buy, and when to sell. The goal is to outperform the market or a designated benchmark.
For a plain-language explanation of the underlying investment types involved, see our guide to stocks, bonds, and index funds.
| Index Funds | Actively Managed Funds | |
|---|---|---|
| Management Style | Passive - tracks a benchmark | Active - manager makes decisions |
| Typical Expense Ratio | Often under 0.10% | Often 0.50%-1.00%+ |
| Long-Term Benchmark Outperformance | Matches benchmark by design | Majority underperform over 10-15 years |
| Tax Efficiency | Generally higher (less trading) | Generally lower (more trading) |
| Transparency | Holdings mirror index - highly transparent | Holdings vary; disclosed periodically |
| Best Market Fit | Efficient, large-cap markets | Potentially less-efficient or niche markets |
What the Long-Term Performance Data Generally Shows
The S&P Indices Versus Active (SPIVA) scorecard - a widely cited industry report - consistently finds that the majority of actively managed domestic equity funds underperform their respective benchmark indices over 10- and 15-year periods, net of fees. This pattern has been documented across multiple asset classes and geographies, though results vary by fund category and time window.
It is important to note that this is a general trend, not a universal law. Some active managers do outperform their benchmarks, and certain market segments - such as small-cap international equities or emerging markets - may offer more opportunities for skilled active management because those markets are considered less informationally efficient.
~85%
Active large-cap funds underperforming 15-year benchmark
S&P SPIVA U.S. Scorecard data has repeatedly shown that roughly 80-90% of actively managed U.S. large-cap funds underperform the S&P 500 over 15-year periods, net of fees.
0.03%-1.00%+
Typical expense ratio range across fund types
Morningstar research tracks expense ratios across fund categories; passive funds consistently sit at the lower end while active funds carry higher annual costs.
10-30%
Estimated long-term portfolio value lost to fee drag
Financial planning models illustrate that a 0.75% annual fee difference can reduce a portfolio's ending value by 10-30% over 30 years, depending on return assumptions.
However, identifying which active funds will outperform in advance is notoriously difficult. Research suggests that past outperformance is a weak predictor of future results, and fund rankings shift considerably from one decade to the next.
The Cost Equation: Why Fees Compound Against You
One of the clearest and most measurable distinctions between the two approaches is cost. Index funds typically carry expense ratios (the annual fee expressed as a percentage of assets) that are a fraction of those charged by actively managed funds. Many broad-market index funds carry expense ratios under 0.10%, while actively managed funds often range from 0.50% to over 1.00% annually.
Calculate the Real Cost of Fees
Before investing in any fund, look up its expense ratio in the fund's prospectus or on a financial data site. Even a 0.50% difference sounds small annually, but over 20 or 30 years it can represent tens of thousands of dollars in foregone growth on a modest portfolio. Many retirement plan calculators allow you to model fee scenarios - it is worth running the numbers for your own situation.
Over a 30-year investment horizon, that seemingly small difference in annual fees can translate into a meaningful reduction in final portfolio value due to the compounding effect. A portfolio growing at 7% annually before fees will produce substantially different outcomes at 0.05% versus 0.80% in annual costs - not because of market returns, but purely because of fee drag.
Tax efficiency is another dimension. Index funds tend to generate fewer capital gains distributions because they trade less frequently, which can be advantageous in taxable brokerage accounts. To understand which account types are most relevant to your situation, see our overview of U.S. savings and investment accounts.
When Active Management May Make Sense
Passive investing is not always the default answer for every investor or every portfolio segment. Active management may merit consideration in specific contexts:
- Less-efficient markets: In markets where information is harder to access or price quickly - such as certain emerging market equities or high-yield bonds - skilled active managers may have more opportunity to add value.
- Specialty strategies: Some investors use active funds for specific tactical objectives, such as downside protection or income generation, that a broad index may not address.
- Behavioral support: Some investors find that the presence of a professional manager helps them stay invested during volatile periods, reducing the risk of panic-driven decisions.
None of these factors guarantee outperformance. They simply illustrate that the active-versus-passive question is not always black and white, and that a blended approach is common among diversified portfolios.
This article is for general informational and educational purposes only. It does not constitute personalized investment, financial, tax, or legal advice. Investment involves risk, including the possible loss of principal. Past performance does not guarantee future results. Please consult a qualified, licensed financial adviser before making decisions about your own financial situation.

Author
Money & Finance Editorial Team
Money & Finance Editorial Team is the collective byline for our editorial team and contributor network. Articles published under this byline or an editorial pen name are researched, written, and reviewed according to our editorial standards for clarity, consistency, and independence before publication.
View all articles →