
Reading a Price History Before You Buy
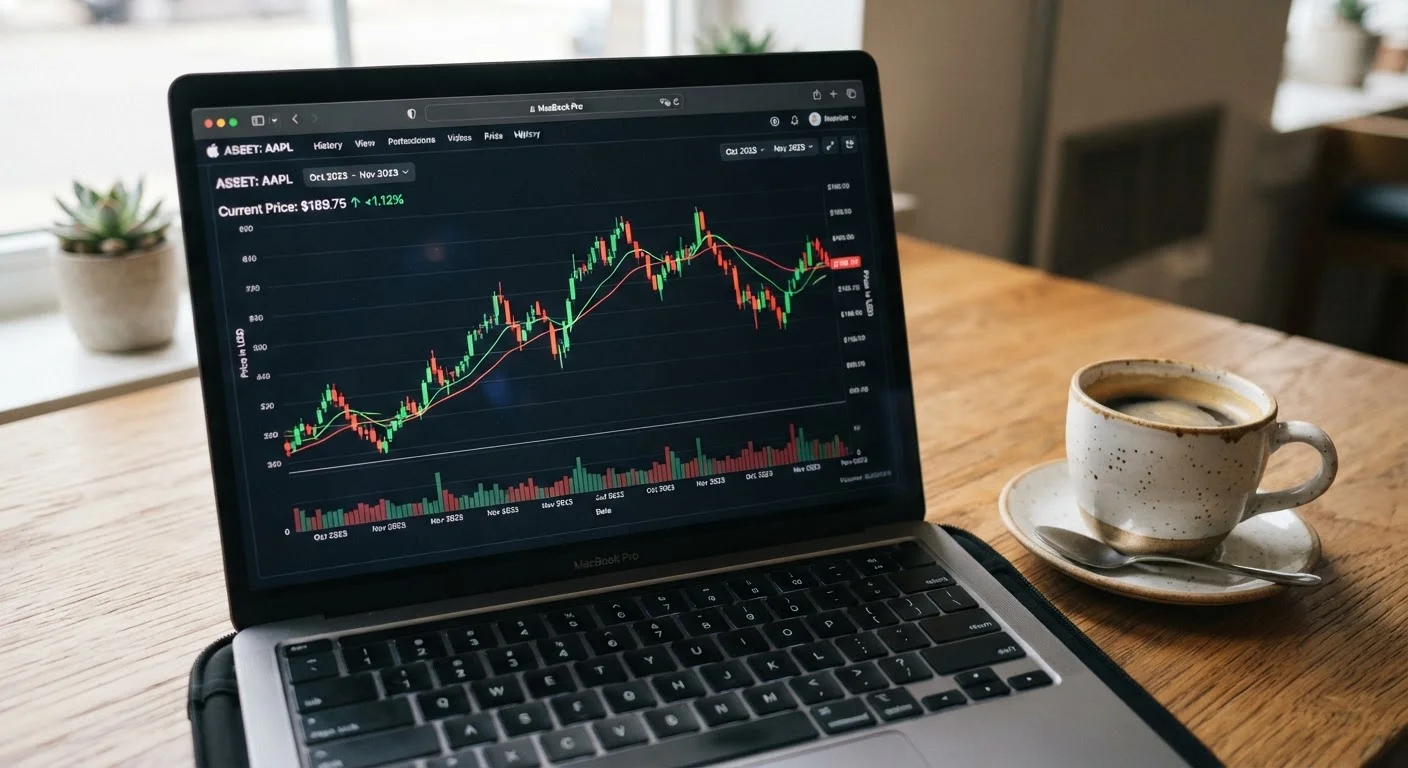
Photo credit: TopInfoTabs.com | Easy Insights For Inspiration
In this article
Price tracking tools reveal whether a deal is genuinely rare or just a return to normal. Learn what to look for and how to interpret the data.
Key Takeaways
- A price history chart reveals whether a current price is a genuine low or just the product's normal going rate.
- Many advertised discounts are calculated from inflated 'original' prices the item rarely sold at.
- Seasonal price patterns help you decide when to wait versus when to act.
- Trend direction and price volatility matter as much as the single lowest data point.
- Price history is one input - always account for total cost, including fees, before deciding.
Why Price History Changes What a Deal Actually Means
A sale badge tells you a price is lower than something - but lower than what, and by how much in real terms? Without context, a 30% discount claim is almost meaningless. It depends entirely on whether the reference price was legitimate. Price history tools address this by pulling publicly available pricing data over time and charting it, giving you a factual baseline against which to evaluate any current offer.
This matters because retail pricing is not static and is not always straightforward. Prices are adjusted frequently in response to demand, competition, inventory levels, and promotional calendars. What looks like a discount may simply be the product returning to a price it holds for most of the year. Conversely, a product with a modest headline discount might genuinely be at a multi-year low - and that context is what makes it worth acting on.
Inflated Reference Prices Are Common
Retailers sometimes set a high 'regular' or 'list' price that an item is rarely sold at, then advertise a percentage-off discount against that figure. The Federal Trade Commission has issued guidance noting this practice can mislead consumers. A price history chart is one of the most reliable ways to check whether the 'original' price was ever a real market price.
Understanding price history is also part of a broader discipline of separating price from value. A historically low price on something you do not need, or on a product with high ownership costs, is still a poor financial decision. Our article on value versus price covers that distinction in detail.
What You Need Before You Start
Reading a price history does not require technical skills, but it does require a couple of lightweight tools and a clear product in mind.
What you will need
Browser-based price tracker extension
Overlays historical price charts directly on retail product pages so you can view price trends without leaving the site.
Dedicated price-history website
Lets you search any product by name or URL and view multi-year price charts, including price alerts by email.
Spreadsheet or notes app
Useful for recording your own observations across multiple products when comparing over time.
With these in place, the actual process of reading a price chart takes only a few minutes per product. The steps below walk through exactly what to look for.
How to Read and Act on a Price History Chart
Pull up the price history chart
Navigate to the product listing on the retailer's site. If you have a browser extension installed, the historical price chart will typically appear automatically on the page. Alternatively, copy the product URL and paste it into a standalone price-tracking site. Make sure the chart is loading data from the same retailer you intend to buy from - prices vary significantly between sellers.
Set the time range to at least 12 months
A 30-day view can look dramatic when a price dropped last week, but it tells you almost nothing about the product's real price baseline. Extend the chart to 12 months minimum, and to 24 months if the data is available. A longer window reveals whether today's price is genuinely a low point or simply where the product has been sitting most of the time.
Identify the historical average and the genuine floor
Most tracking tools display the all-time low and sometimes a rolling average. Note both figures. The all-time low tells you what is theoretically possible; the average tells you what is normal. If today's price is at or near the all-time low, that is meaningful. If today's price is at or slightly below average, the discount being advertised is likely modest in real terms.
Read the trend direction
Look at whether prices are trending upward, downward, or staying flat over the past six months. A product with a downward trend may get even cheaper if you can wait. A product with a rising trend suggests the current price may be relatively favorable compared to what is coming. Flat patterns indicate stability - the price is unlikely to change dramatically in either direction soon.
Check for seasonal price patterns
Electronics, appliances, and many household goods follow predictable seasonal cycles. Look for recurring dips in the chart that align with major retail sale periods. If the chart shows a consistent annual low at a particular time of year, and you are not currently near that window, it may be worth waiting. If you are already in that window and the price matches historical lows, the timing is likely favorable.
Factor in the full cost before deciding
A strong price history reading is only one part of the picture. Before acting, account for shipping costs, potential return fees, and any membership costs required to access that price. These can materially change whether the effective price is as good as the chart suggests. See our guide to hidden costs that erode discounts for a practical breakdown of what to add back in.
Set a Target Price, Not Just an Alert
Most price-tracking tools let you set a threshold alert. Before doing so, identify the price point that genuinely works for your budget - not just any drop from current. This prevents you from acting on a trivial decline that still leaves the item overpriced relative to its historical average.
Once you have worked through this process, you will have a clearer picture of whether the current price represents genuine value or routine retail positioning. For a broader pre-purchase framework, see our pre-purchase checklist for evaluating any deal.
Price History Has Blind Spots
Third-party price trackers only capture data from the retailers they monitor, and coverage gaps do exist. A product relaunched under a new SKU or listing will appear to have a short history even if it has been sold for years. Always cross-check across more than one source and treat very short histories with extra skepticism.
Common Misreads and How to Avoid Them
Even with a chart in front of you, a few interpretive pitfalls can lead to poor conclusions.
- Anchoring to the all-time low: If a product hit its lowest price once during an unusual period - say, an overstock clearance - that data point may not be repeatable. Weight recurring lows more heavily than single outliers.
- Ignoring product versions: A price drop may reflect a newer model replacing the current one, signaling that the item you are looking at is being phased out. Check whether a successor model exists before assuming the low price is purely a bargain.
- Confusing third-party sellers: Some charts aggregate prices from marketplace sellers alongside the main retailer. A very low outlier may reflect a third-party listing with different shipping terms, return policies, or seller reliability.
These nuances are also relevant beyond product shopping. If you are evaluating pricing in other categories - such as vehicle purchases - similar principles about reference prices and historical data apply. Our piece on how car pricing actually works at a dealership covers comparable dynamics in that context.
Reading price history does not guarantee the best possible outcome, but it significantly reduces the risk of paying more than you need to - and of being misled by marketing language framed as consumer savings. For more on this topic, deal-hunting myths that cost people money is a useful companion read.

Author
Smart Shopping Editorial Team
Smart Shopping Editorial Team is the collective byline for our editorial team and contributor network. Articles published under this byline or an editorial pen name are researched, written, and reviewed according to our editorial standards for clarity, consistency, and independence before publication.
View all articles →